05. Quizzes on Data Story Telling
First Visual
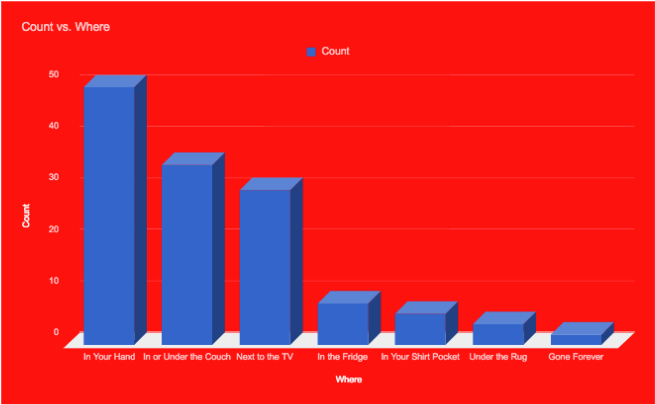
Use the first visual from the previous video to answer the following question.

QUIZ QUESTION::
For each of the visual elements below, mark whether or not you would "Keep" or "Remove" that element from the figure above.
ANSWER CHOICES:
|
Visual Element |
Keep or Remove |
|---|---|
3D aspect |
|
Legend |
|
Ordered Bars |
|
Red Background |
|
Axes/Title Labels |
SOLUTION:
|
Visual Element |
Keep or Remove |
|---|---|
|
3D aspect |
|
|
Legend |
|
|
Red Background |
|
|
Ordered Bars |
|
|
Axes/Title Labels |
|
|
Ordered Bars |
|
|
Axes/Title Labels |
|
|
Ordered Bars |
|
|
Axes/Title Labels |
|
|
3D aspect |
|
|
Legend |
|
|
Red Background |
|
|
3D aspect |
|
|
Legend |
|
|
Red Background |
Second Visual
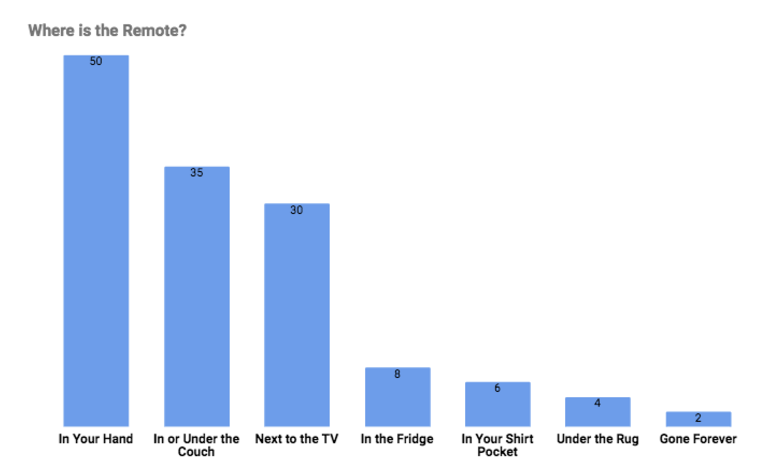
Here is the second visual. Use it to answer the following quiz question.

SOLUTION:
- High data-ink ratio.
- No chart junk.
Final Quiz of the Lesson
This final quiz won't be assessed, but consider one of the questions that was posed in one of the earlier concepts comparing student interest in science before and after attending a science camp. The data for that scenario is provided here in the third sheet.
Task Description:
Use the data linked above to complete the following task list.
Task Feedback:
Great job!